

Stats overview
Introduction
Section titled “Introduction”StatsOverviewWidget renders a horizontal row of stat cards — compact KPI tiles that show a label, a primary value, and optional extras (description, icon, color, sparkline, or link).
Build each card with the fluent Stat API, then attach the list with .stats([...]). Register the widget on the panel like any other widget.
from almasix.orbit.widgets import Stat, StatsOverviewWidget
StatsOverviewWidget.make("overview")    .heading("Overview")    .stats([        Stat.make("Users")            .value(1280)            .description("+4% this week")            .description_icon("heroicon-m-arrow-trending-up")            .color("success")            .icon("heroicon-o-users"),        Stat.make("Posts").value(342).color("primary").icon("heroicon-o-document-text"),        Stat.make("Revenue").value("$12.4k").color("warning").icon("heroicon-o-banknotes"),    ])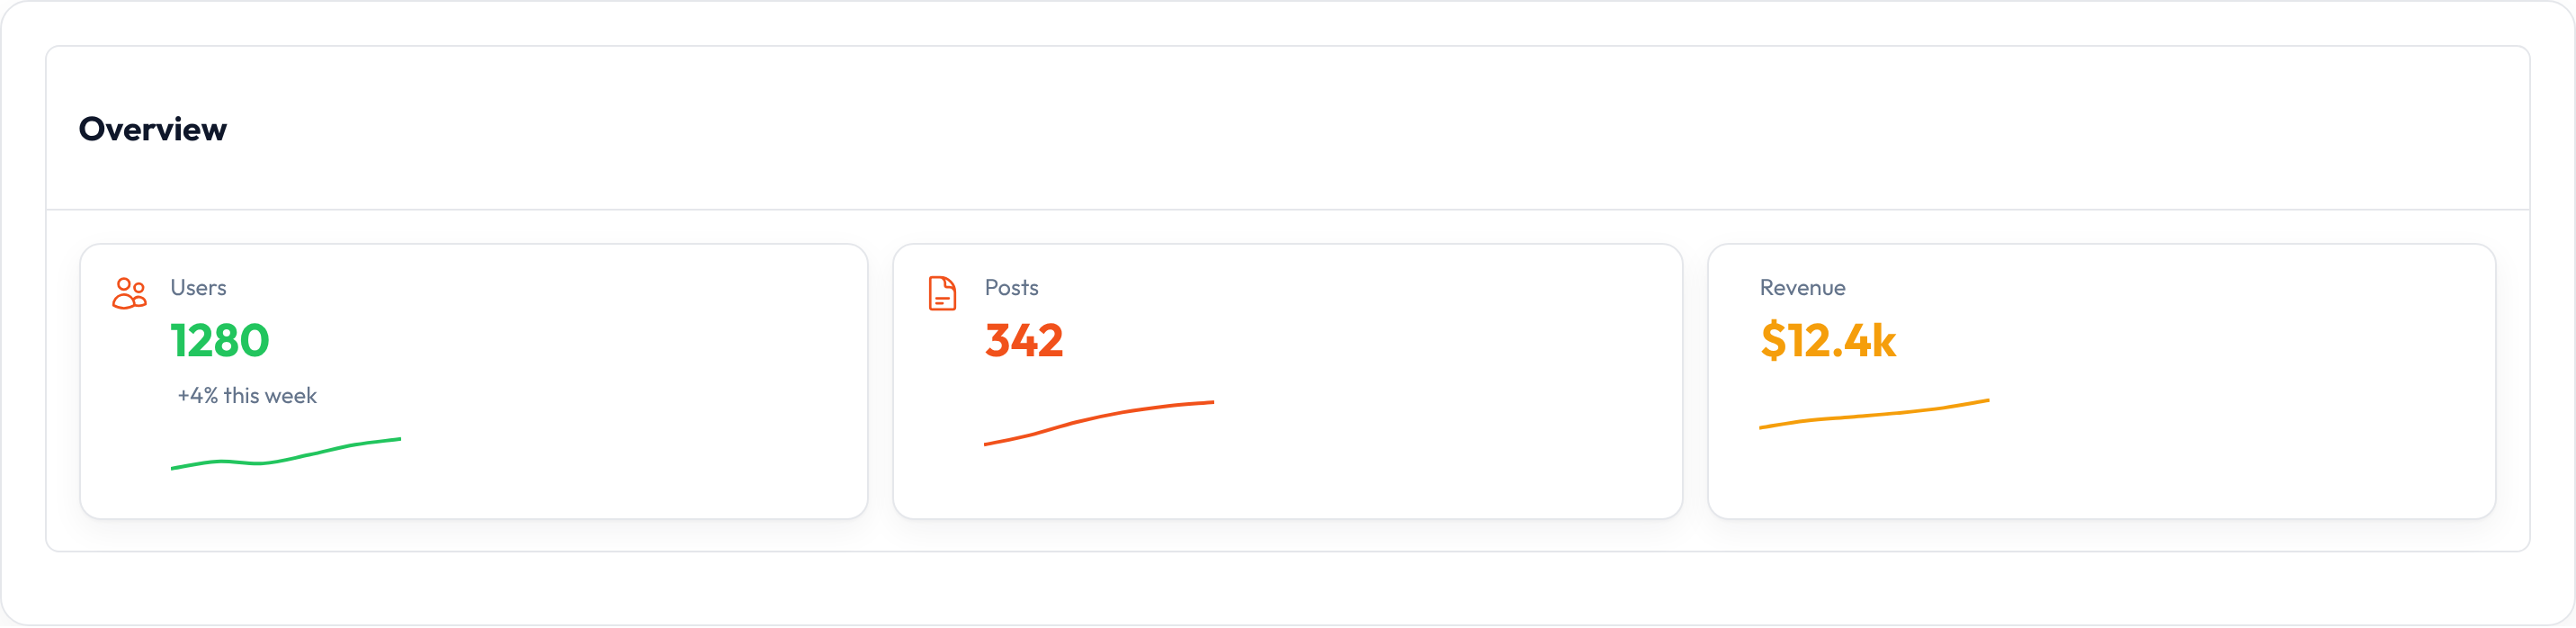
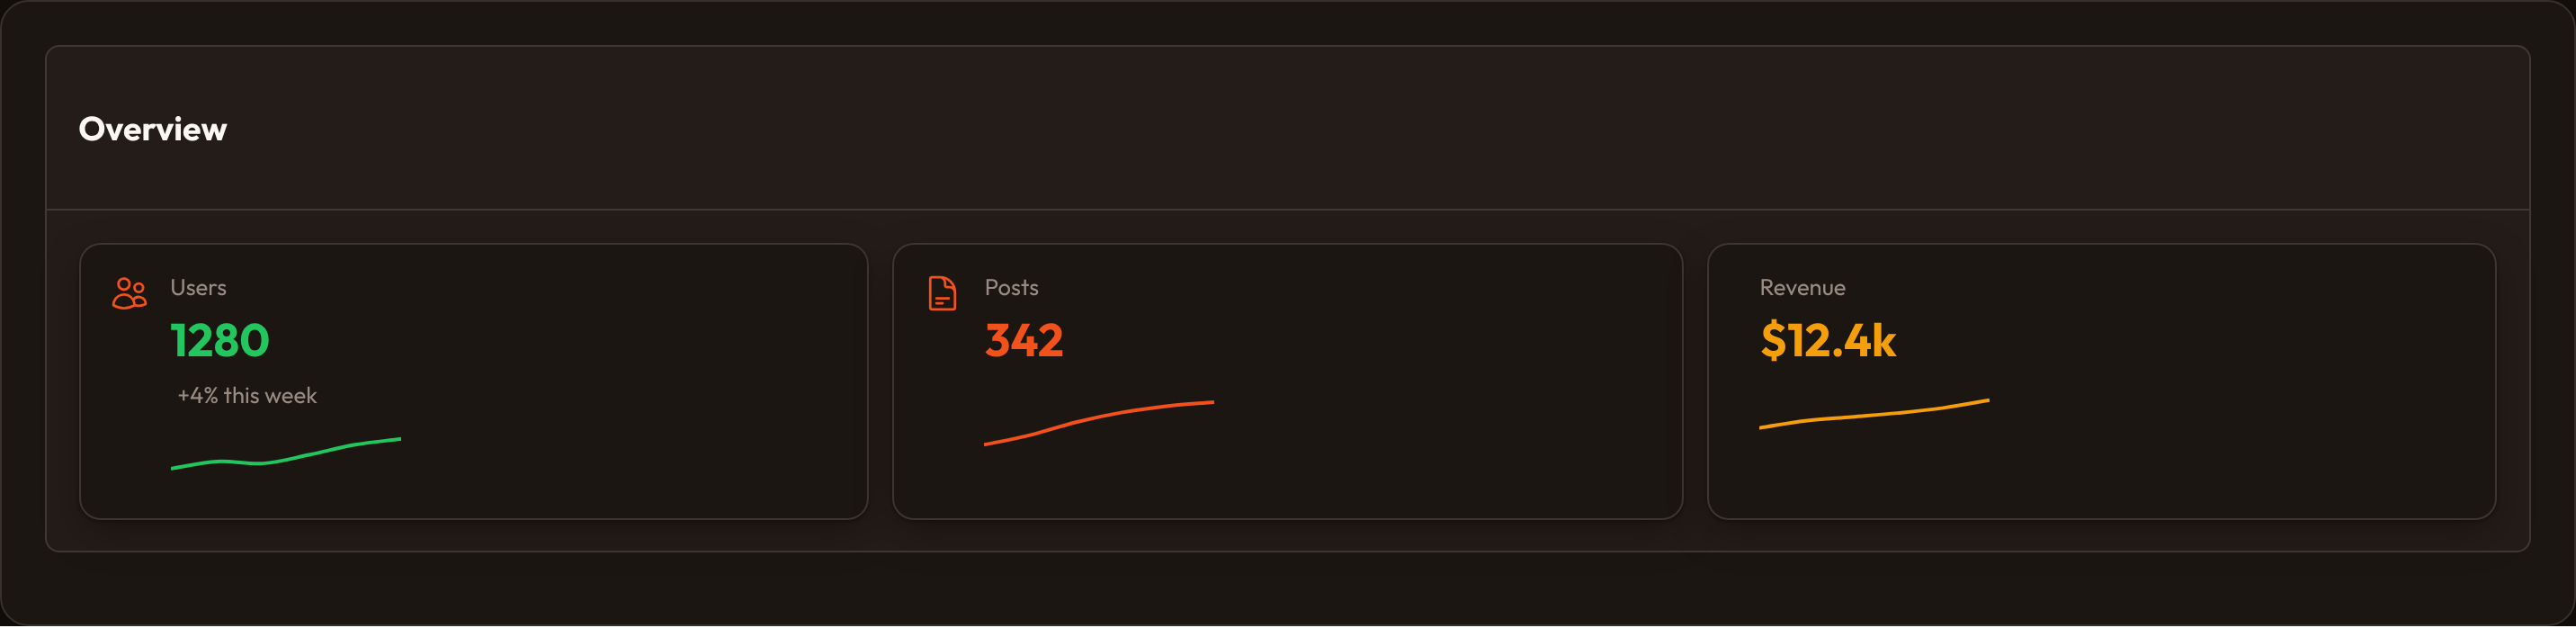
Markup is <div class="or-stats"> wrapping each .or-stat. Import Stat from almasix.orbit.widgets (same package as the widget).
Value and placeholder
Section titled “Value and placeholder”.value(...) sets the primary figure. When the value is missing, .placeholder(...) shows fallback copy instead of a blank card.
from almasix.orbit.widgets import Stat
Stat.make("Open tickets").value(12)Stat.make("Queued jobs").placeholder("—")

Description and icon
Section titled “Description and icon”.description(...) adds a secondary line. .description_icon(...) prefixes that line with a small Heroicon. .icon(...) places a larger icon beside the copy.
from almasix.orbit.widgets import Stat
Stat.make("Signups")    .value(86)    .description("vs last week")    .description_icon("heroicon-m-arrow-trending-up")    .icon("heroicon-o-user-plus")    .color("success")

.color(...) maps to or-color-{name} (primary, success, warning, danger, info, gray, …).
from almasix.orbit.widgets import Stat
Stat.make("Healthy").value("OK").color("success")Stat.make("Attention").value(3).color("warning")Stat.make("Failed").value(1).color("danger")

Sparklines
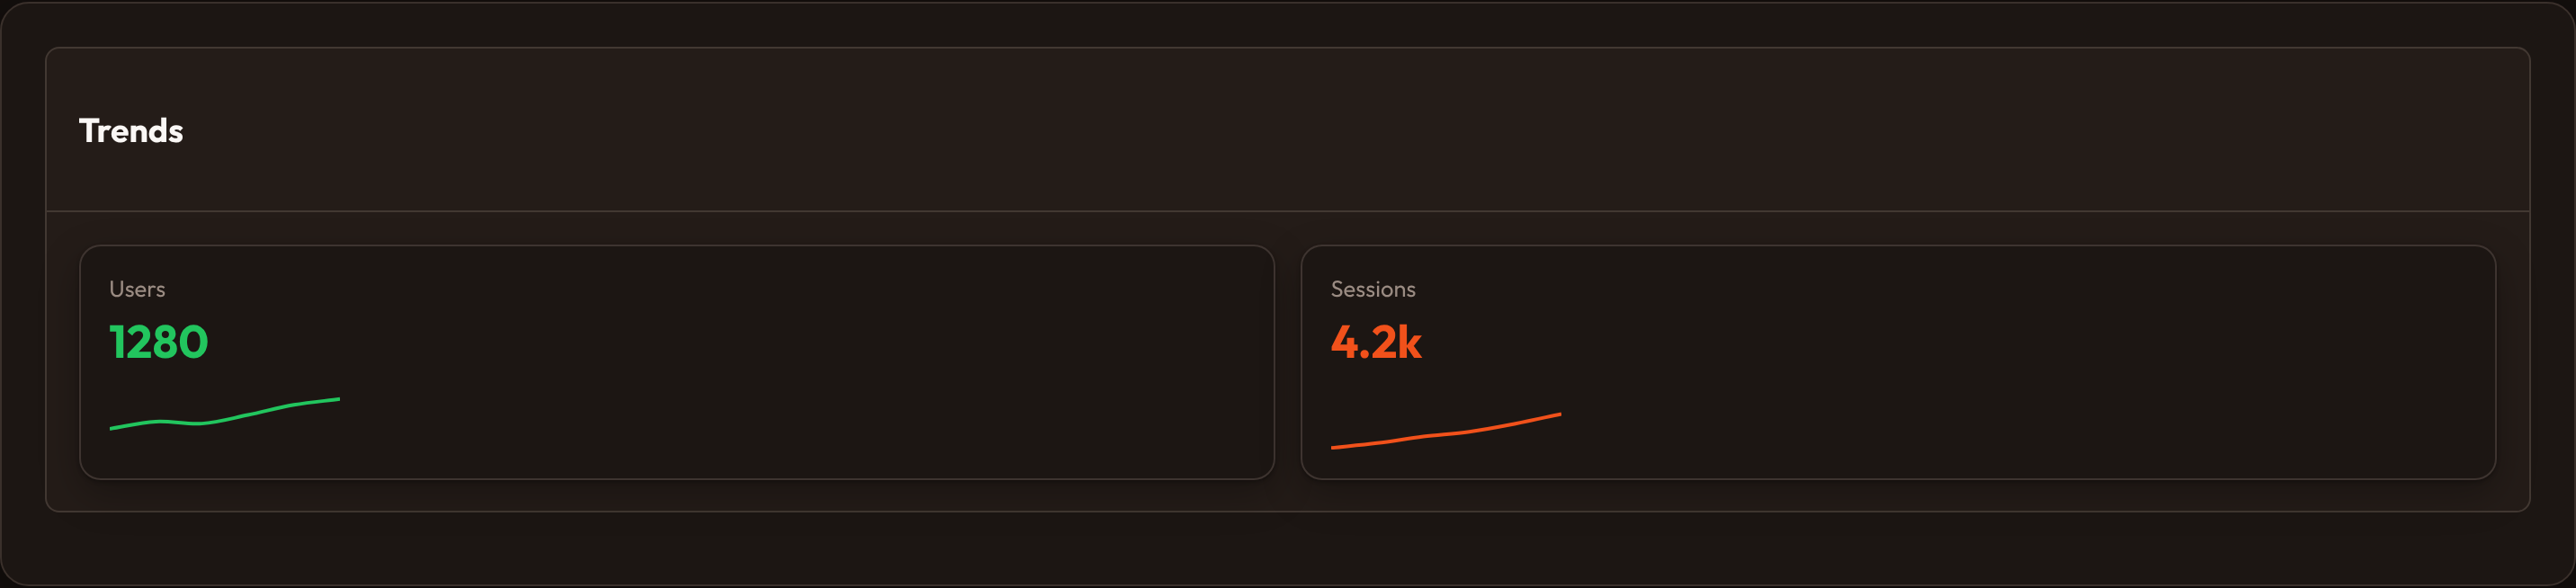
Section titled “Sparklines”.chart([3, 5, 4, 8, 7]) embeds a mini Chart.js sparkline via Alpine orbitSparkline. Values are numeric; color follows the stat’s .color(...).
from almasix.orbit.widgets import Stat, StatsOverviewWidget
StatsOverviewWidget.make("trends").stats([    Stat.make("Users")        .value(1280)        .color("success")        .chart([820, 932, 901, 1034, 1190, 1280]),    Stat.make("Sessions")        .value("4.2k")        .color("primary")        .chart([2.1, 2.4, 2.8, 3.1, 3.6, 4.2]),])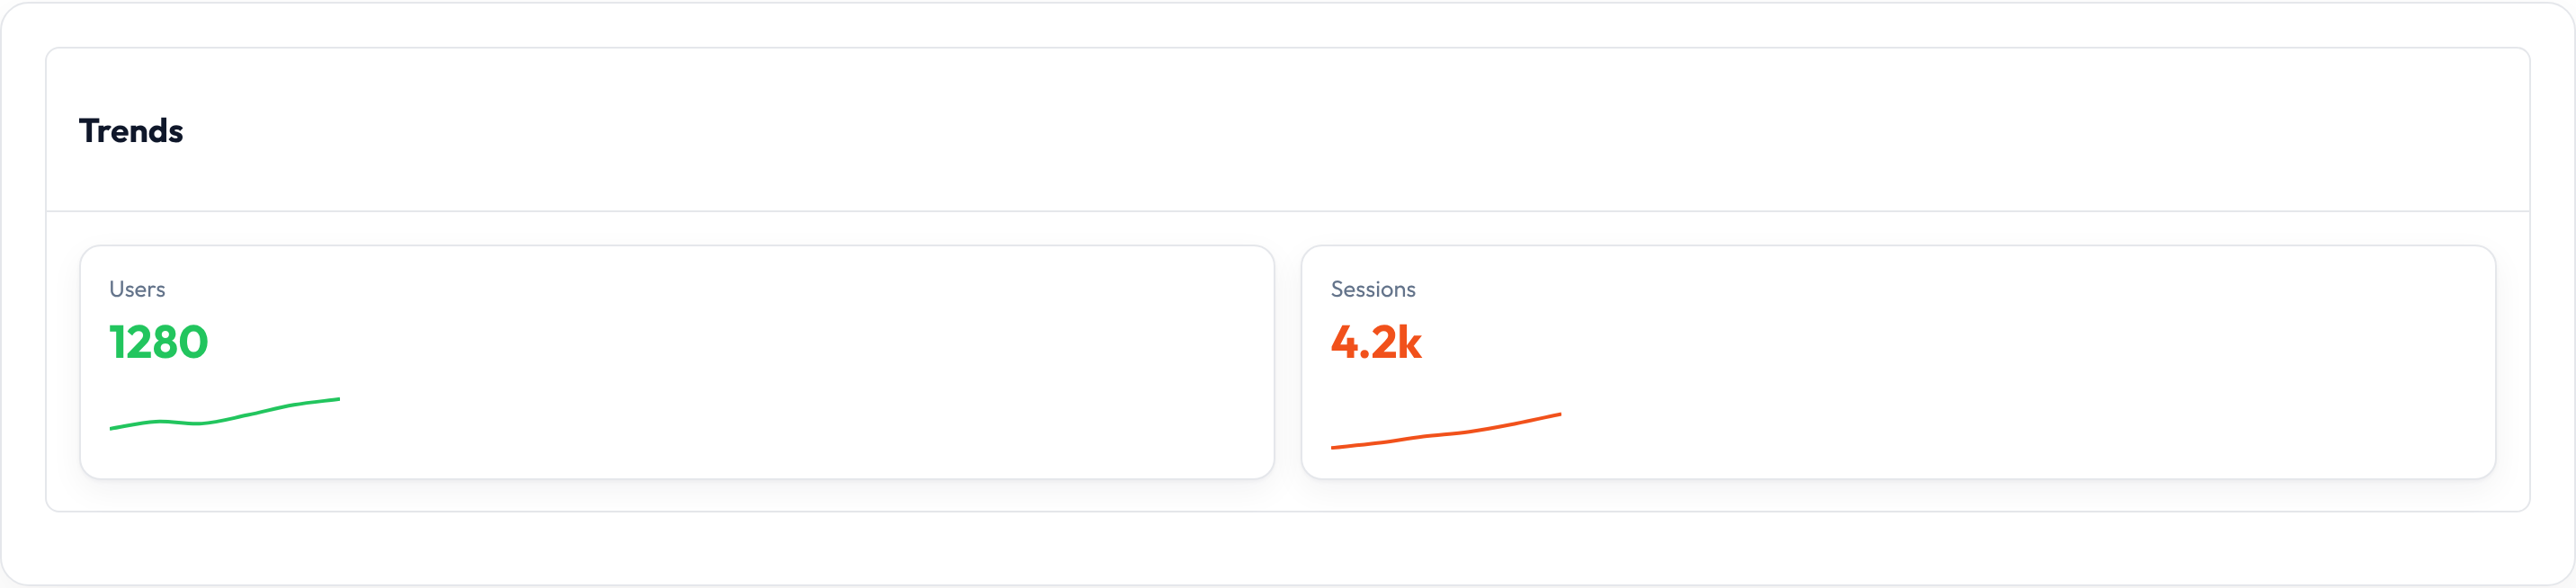
.url(...) wraps the card in an <a class="or-stat"> so the whole card is clickable.
from almasix.orbit.widgets import Stat
Stat.make("Users")    .value(1280)    .url("/admin/users")    .icon("heroicon-o-users")    .color("primary")

Dynamic stats
Section titled “Dynamic stats”Pass callables in .stats([...]) — they receive evaluated context and may return a Stat or a sequence of stats.
from almasix.orbit.widgets import Stat, StatsOverviewWidget
def user_stat(**ctx):    count = ctx.get("user_count", 0)    return Stat.make("Users").value(count).color("success")
StatsOverviewWidget.make("live").stats([user_stat])
On the dashboard
Section titled “On the dashboard”Subclass StatsOverviewWidget, set sort / heading, and configure stats in __init__ (or override get_stats). Register the class on the panel with .widgets([...]).