

Charts
Introduction
Section titled “Introduction”ChartWidget draws dashboard charts. Chart.js is the default library. Switch to ApexCharts with .chart_library("apex") or .chart_library(ChartLibrary.APEX). The panel shell loads both vendor scripts; Alpine orbitChart picks the runtime from data-chart-library.
from almasix.orbit.widgets import ChartWidget
ChartWidget.make("signups")    .heading("Signups")    .description("Last 7 days")    .chart_type("line")    .labels(["Mon", "Tue", "Wed", "Thu", "Fri", "Sat", "Sun"])    .datasets([{"label": "Users", "data": [12, 19, 14, 22, 18, 25, 30]}])    .color("primary")    .max_height("280px")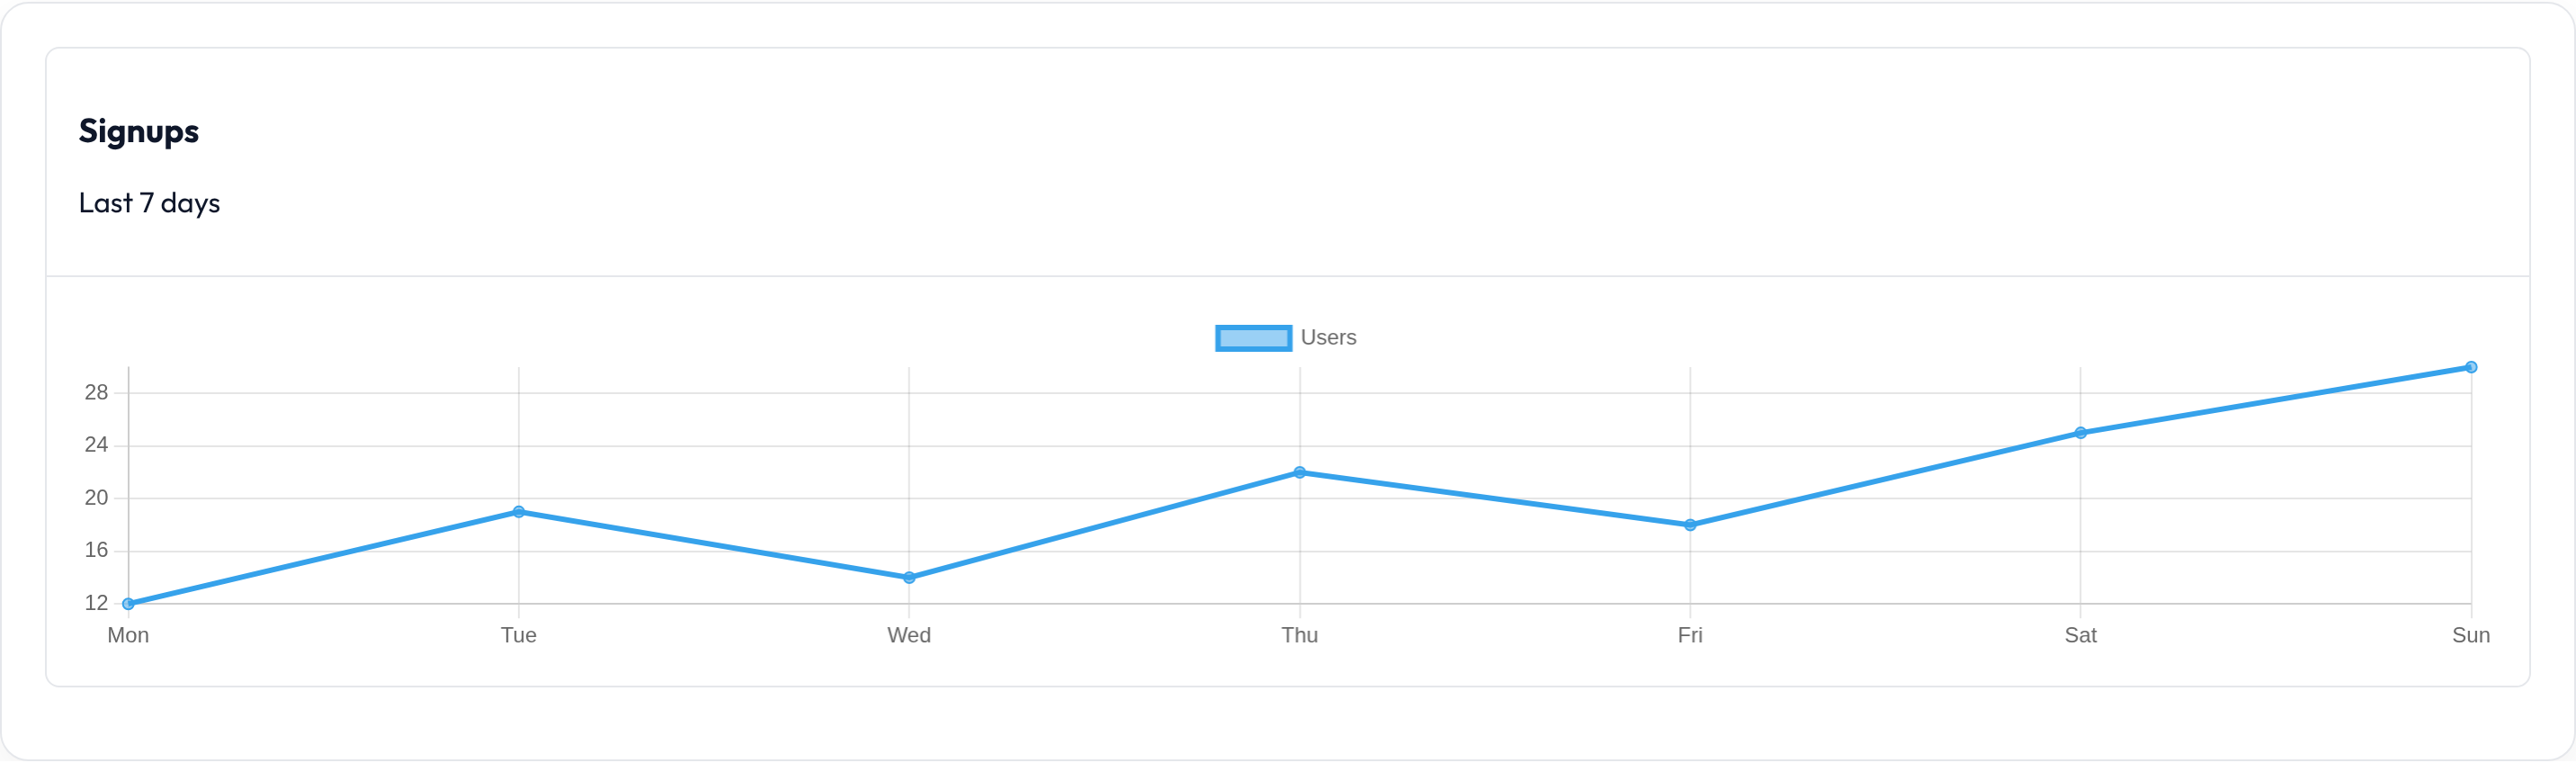
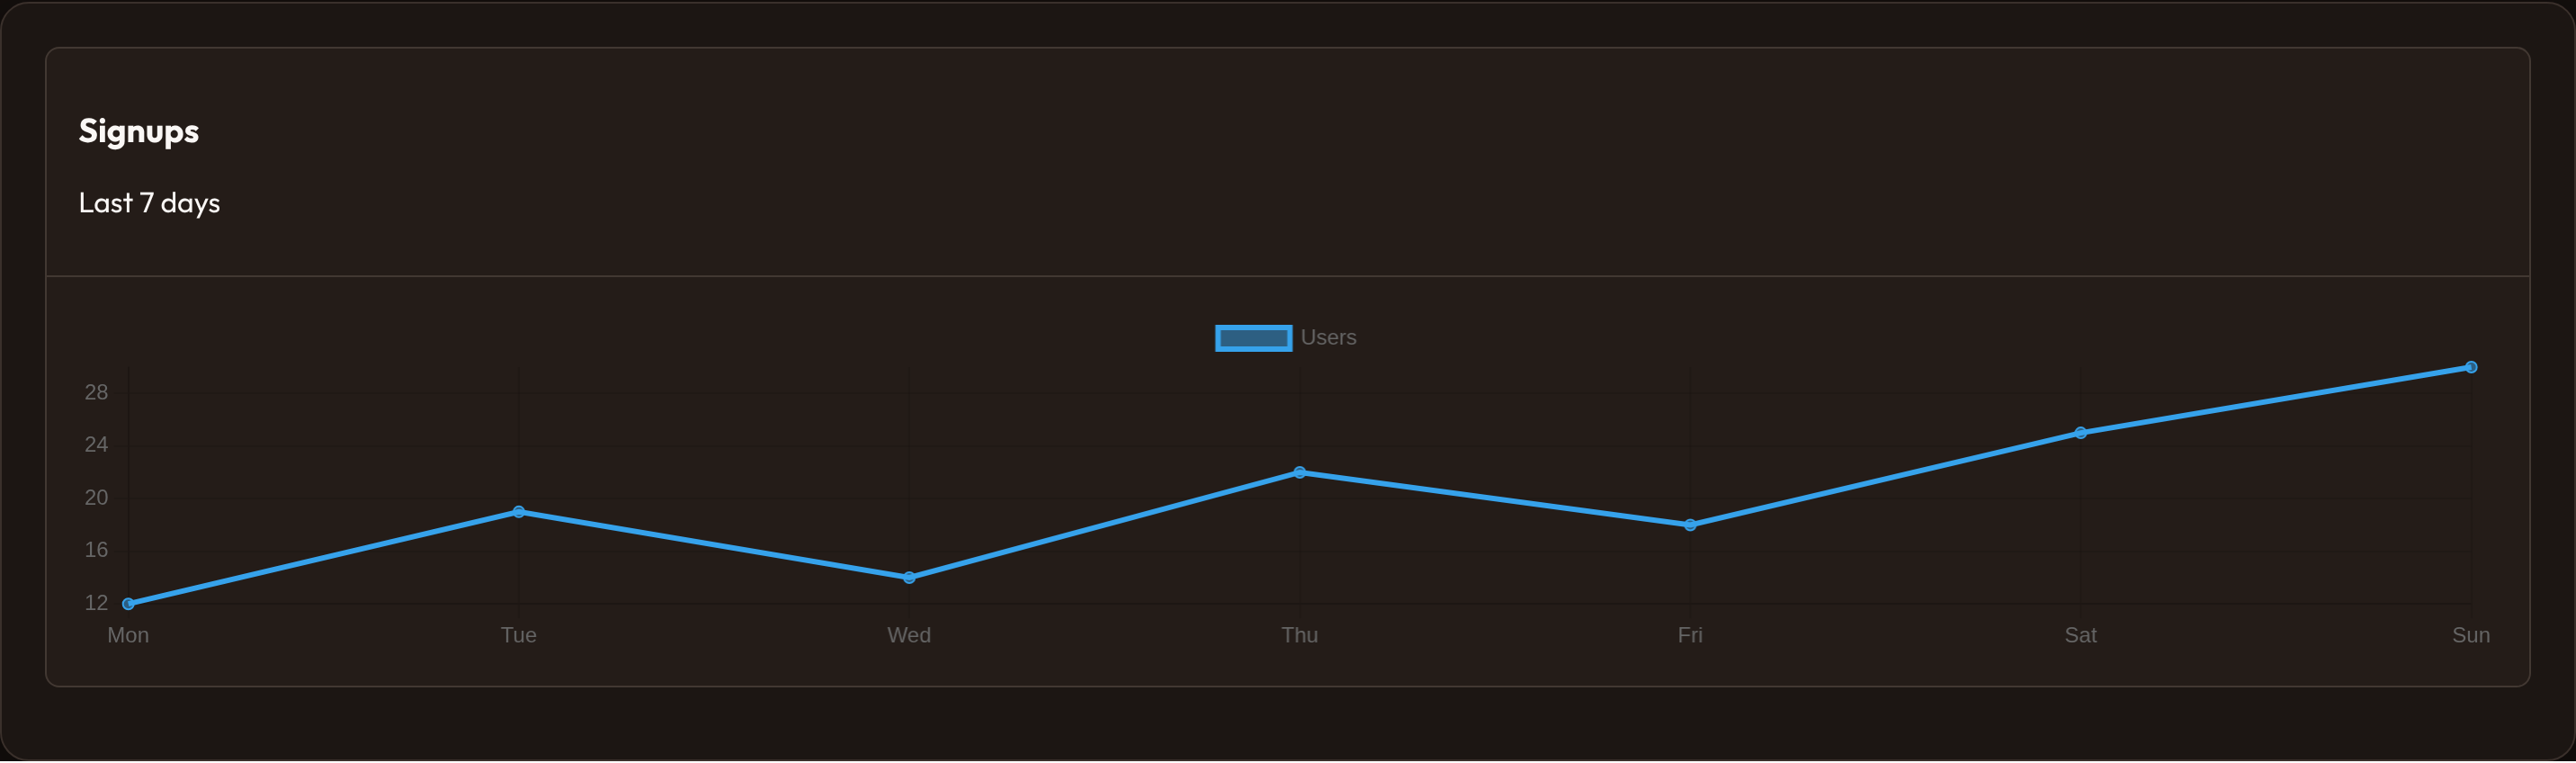
Chart libraries
Section titled “Chart libraries”| Library | How to select | Payload |
|---|---|---|
| Chart.js (default) | .chart_library("chartjs") or omit |
get_data() — type / labels / datasets / options |
| ApexCharts | .chart_library("apex") or ChartLibrary.APEX |
get_apex_options() or .apex_options({...}) |
from almasix.orbit.widgets import ChartLibrary, ChartWidget
# Chart.js (default)ChartWidget.make("js")    .heading("Chart.js")    .chart_library(ChartLibrary.CHARTJS)    .chart_type("bar")    .labels(["A", "B", "C"])    .datasets([{"label": "Series", "data": [3, 7, 4]}])
# ApexChartsChartWidget.make("apex")    .heading("ApexCharts")    .chart_library(ChartLibrary.APEX)    .chart_type("area")    .labels(["A", "B", "C"])    .datasets([{"label": "Series", "data": [3, 7, 4]}])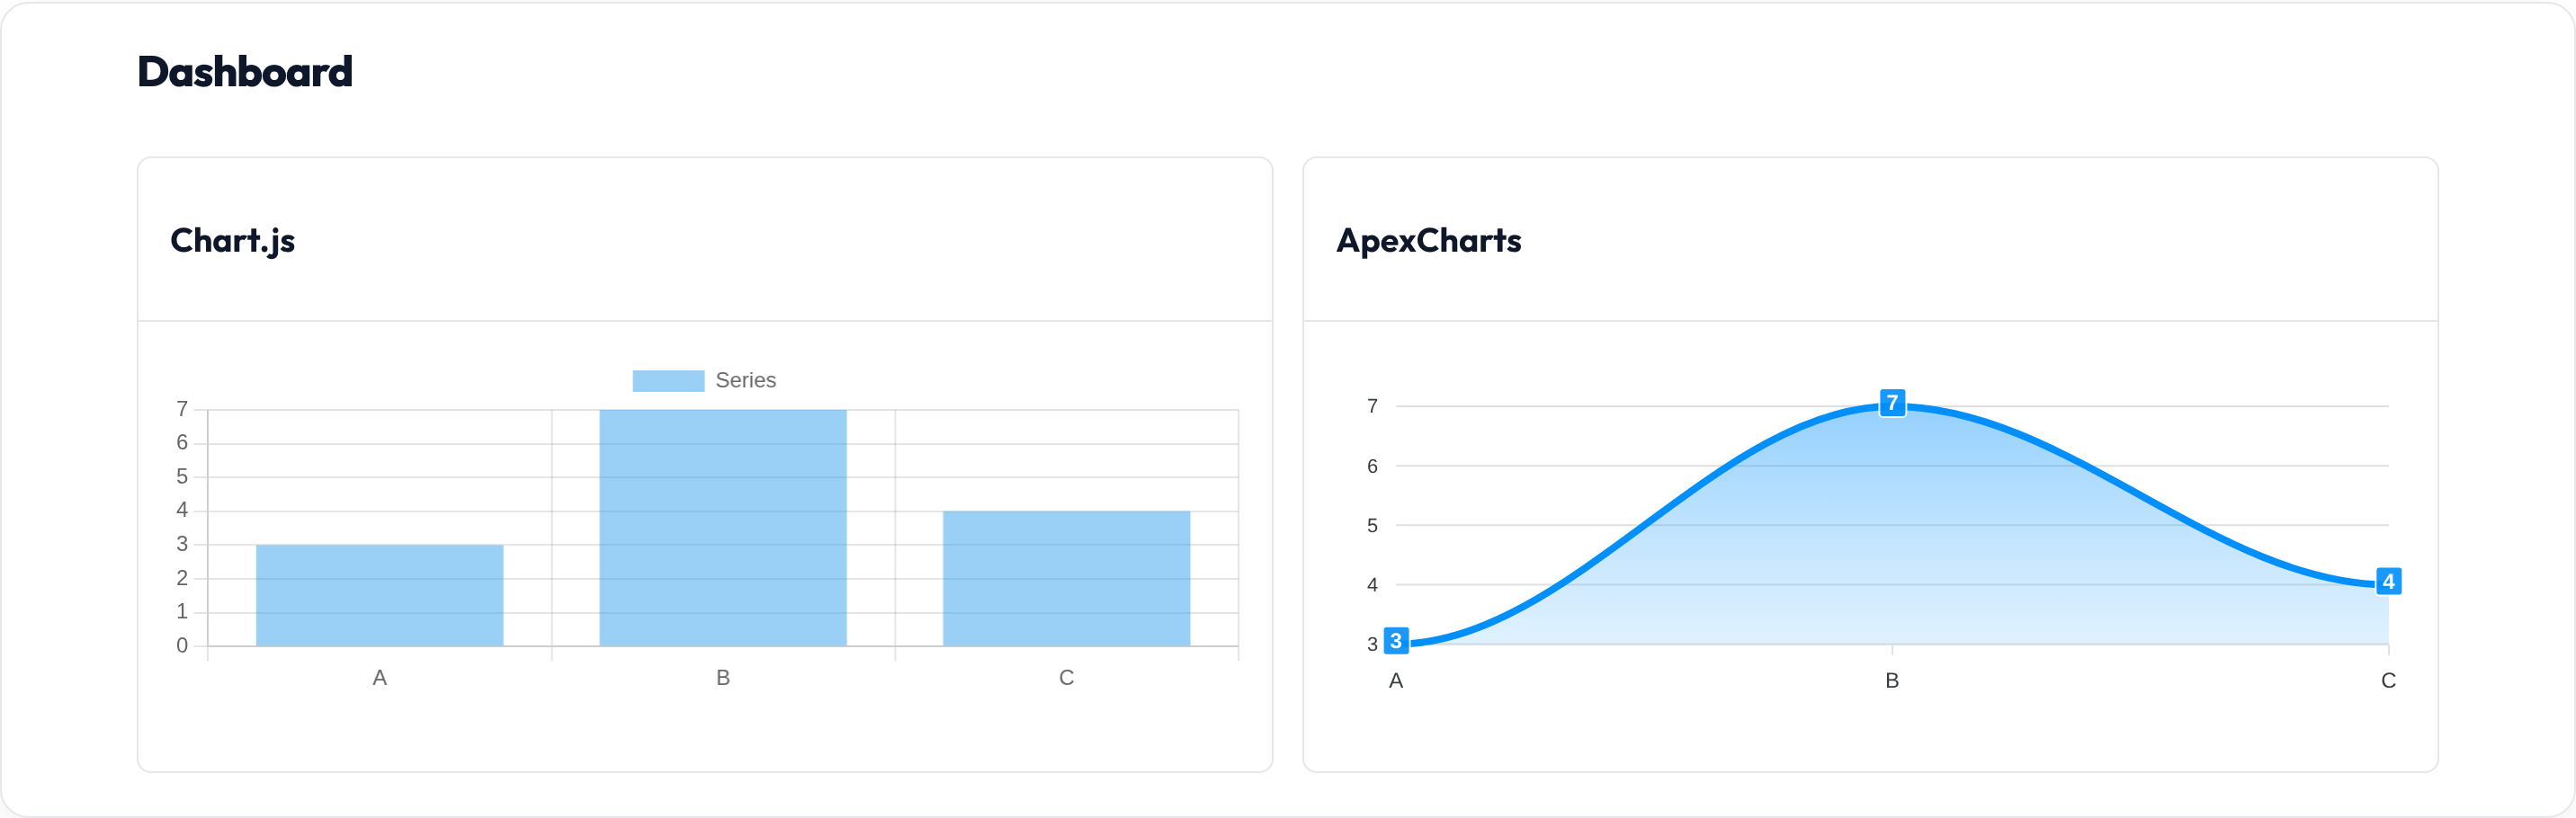
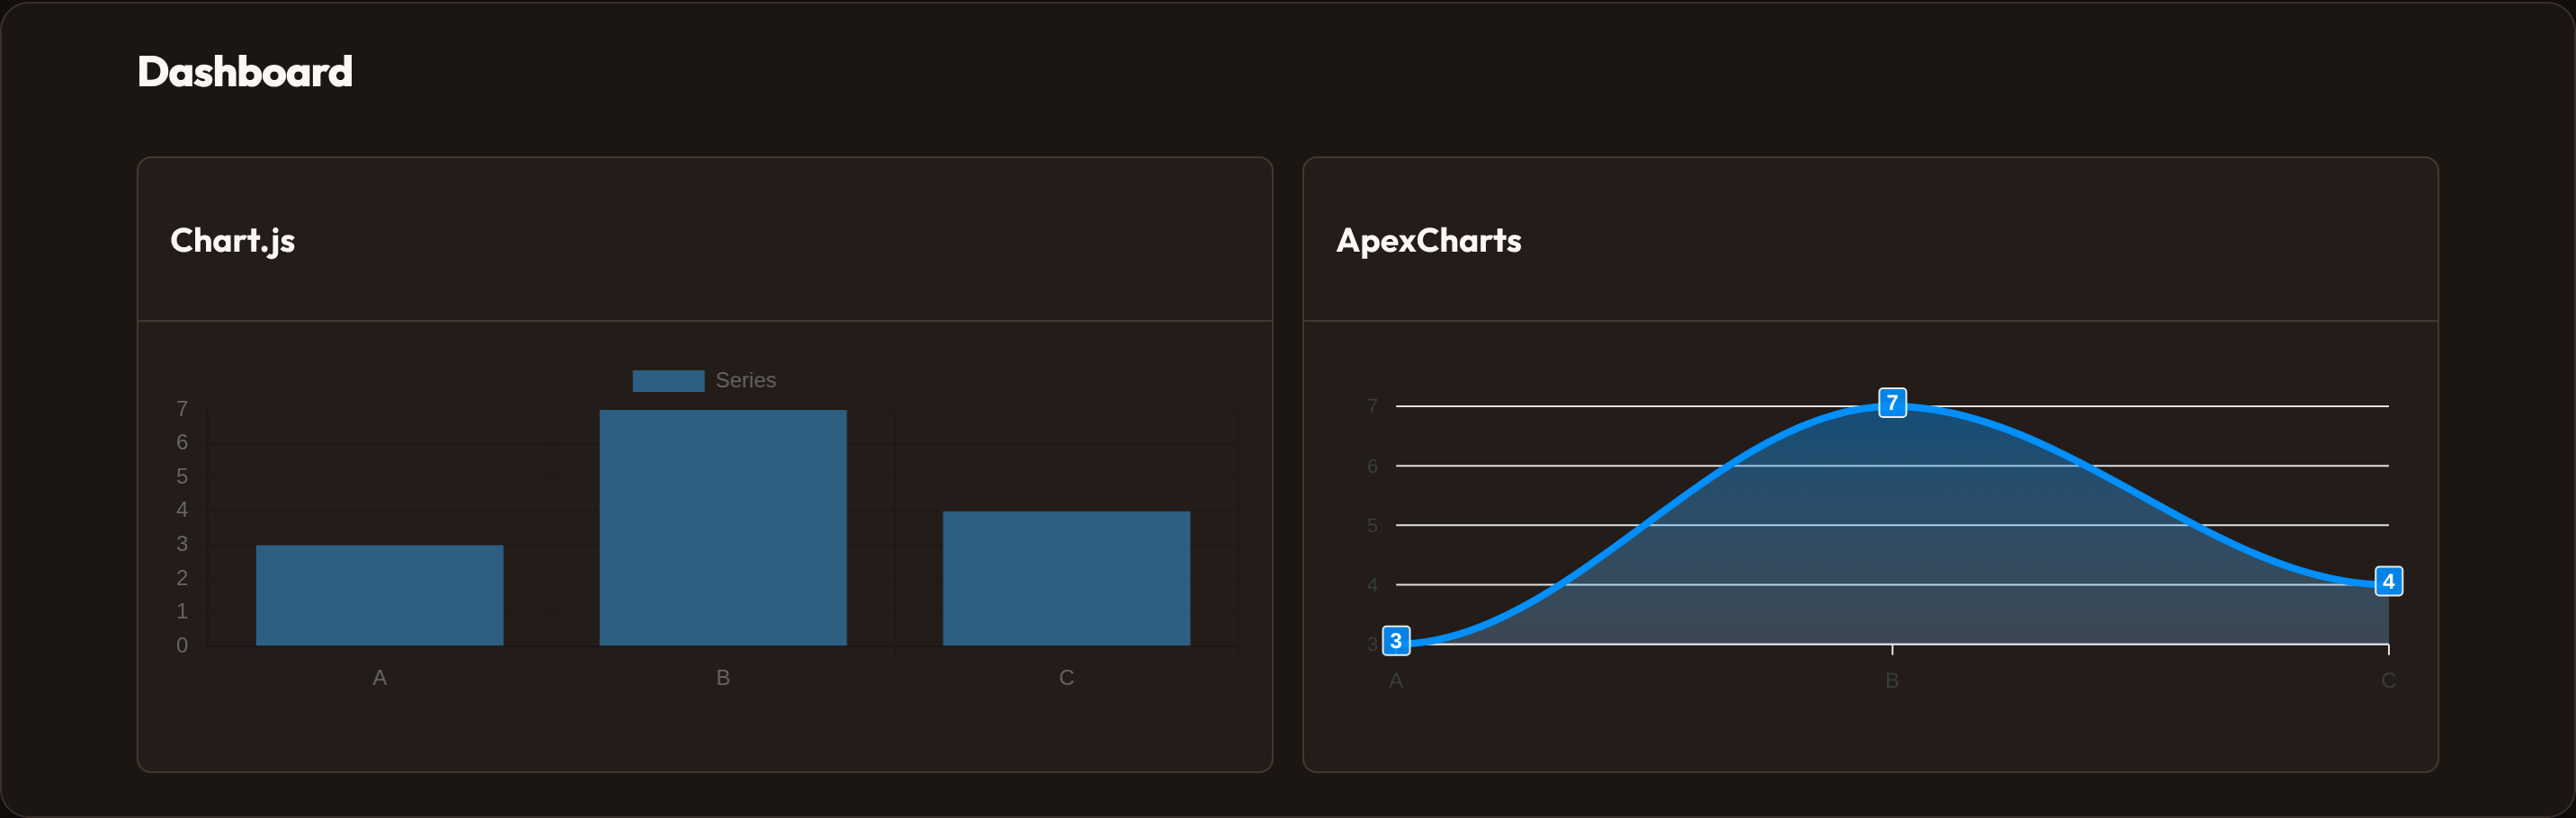
When using Apex without a custom .apex_options(...), Orbit translates Chart.js-shaped labels/datasets into an Apex options object (doughnut → donut, pie/donut series flattening, x-axis categories).
Chart type
Section titled “Chart type”.chart_type(...) accepts Chart.js types such as line, bar, doughnut, pie, and radar. Apex receives the same string (with doughnut remapped to donut).
from almasix.orbit.widgets import ChartWidget
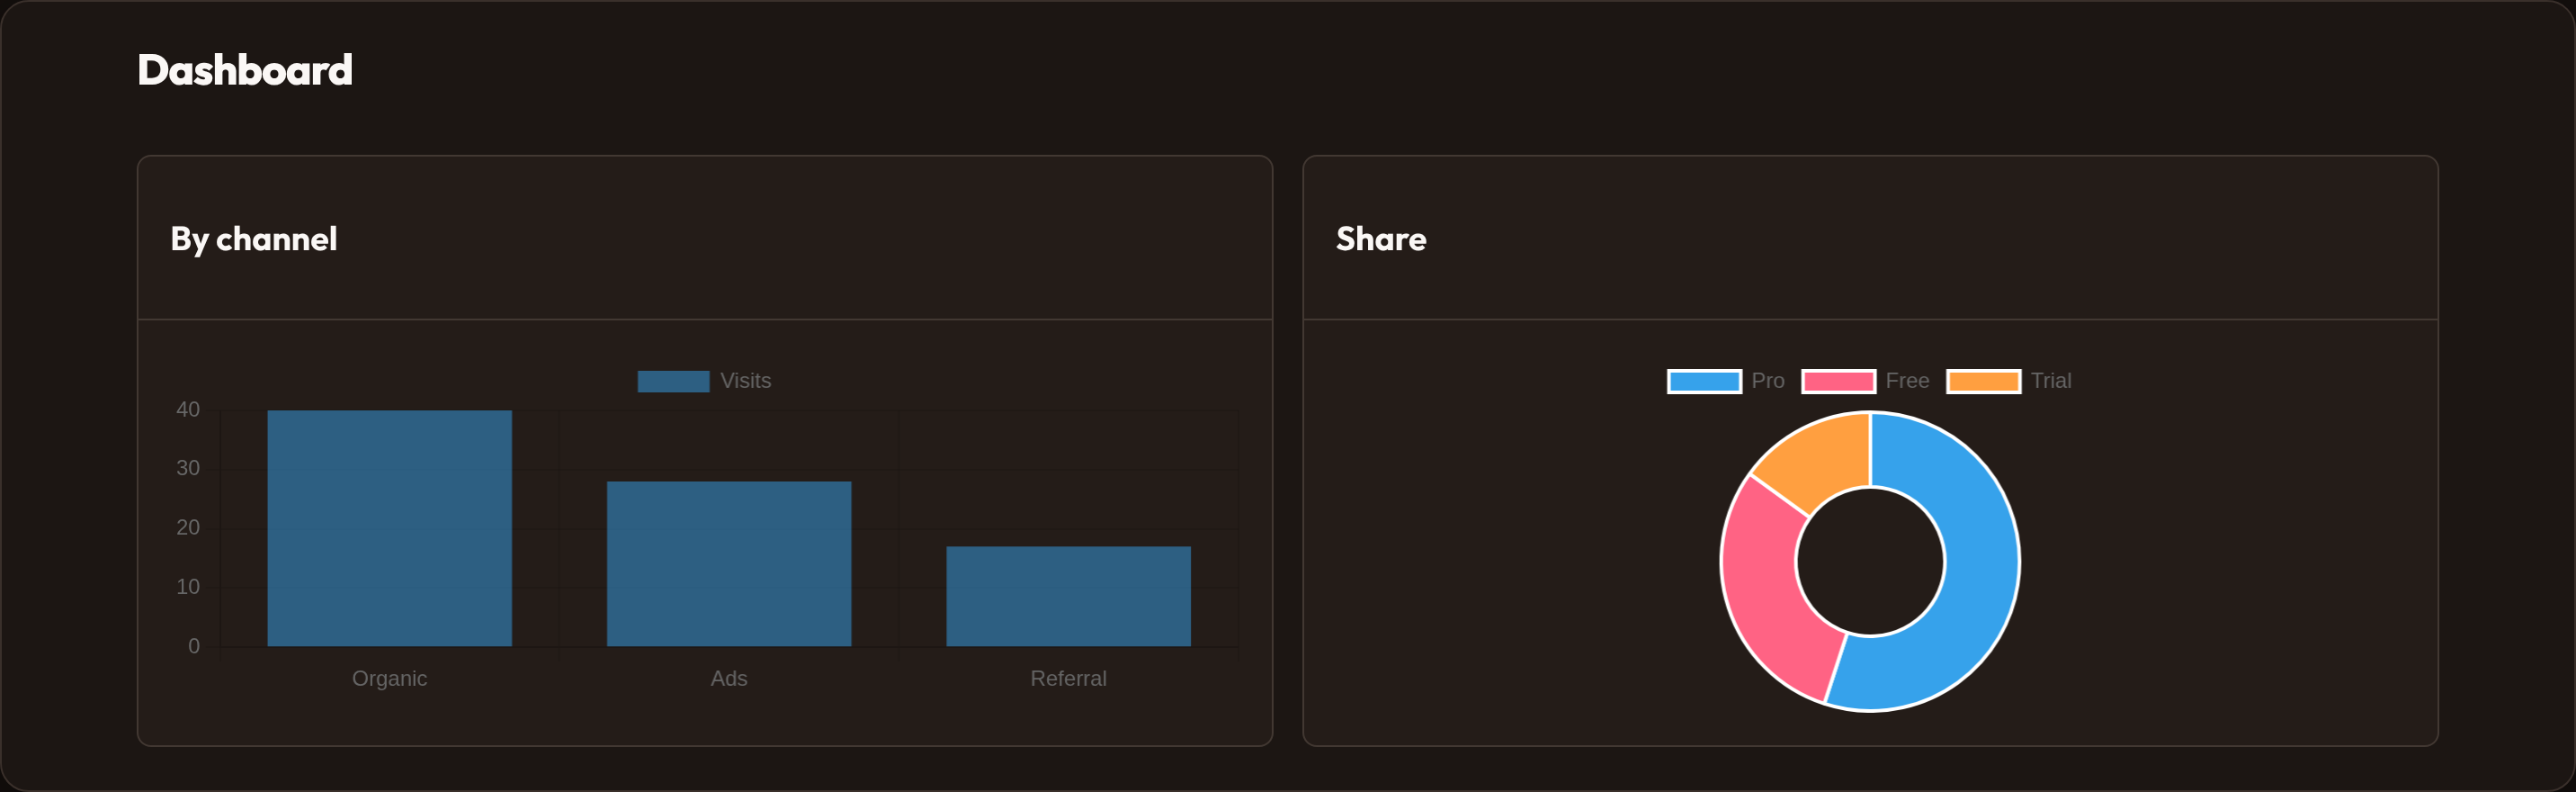
ChartWidget.make("bars")    .heading("By channel")    .chart_type("bar")    .labels(["Organic", "Ads", "Referral"])    .datasets([{"label": "Visits", "data": [40, 28, 17]}])
ChartWidget.make("share")    .heading("Share")    .chart_type("doughnut")    .labels(["Pro", "Free", "Trial"])    .datasets([{"data": [55, 30, 15]}])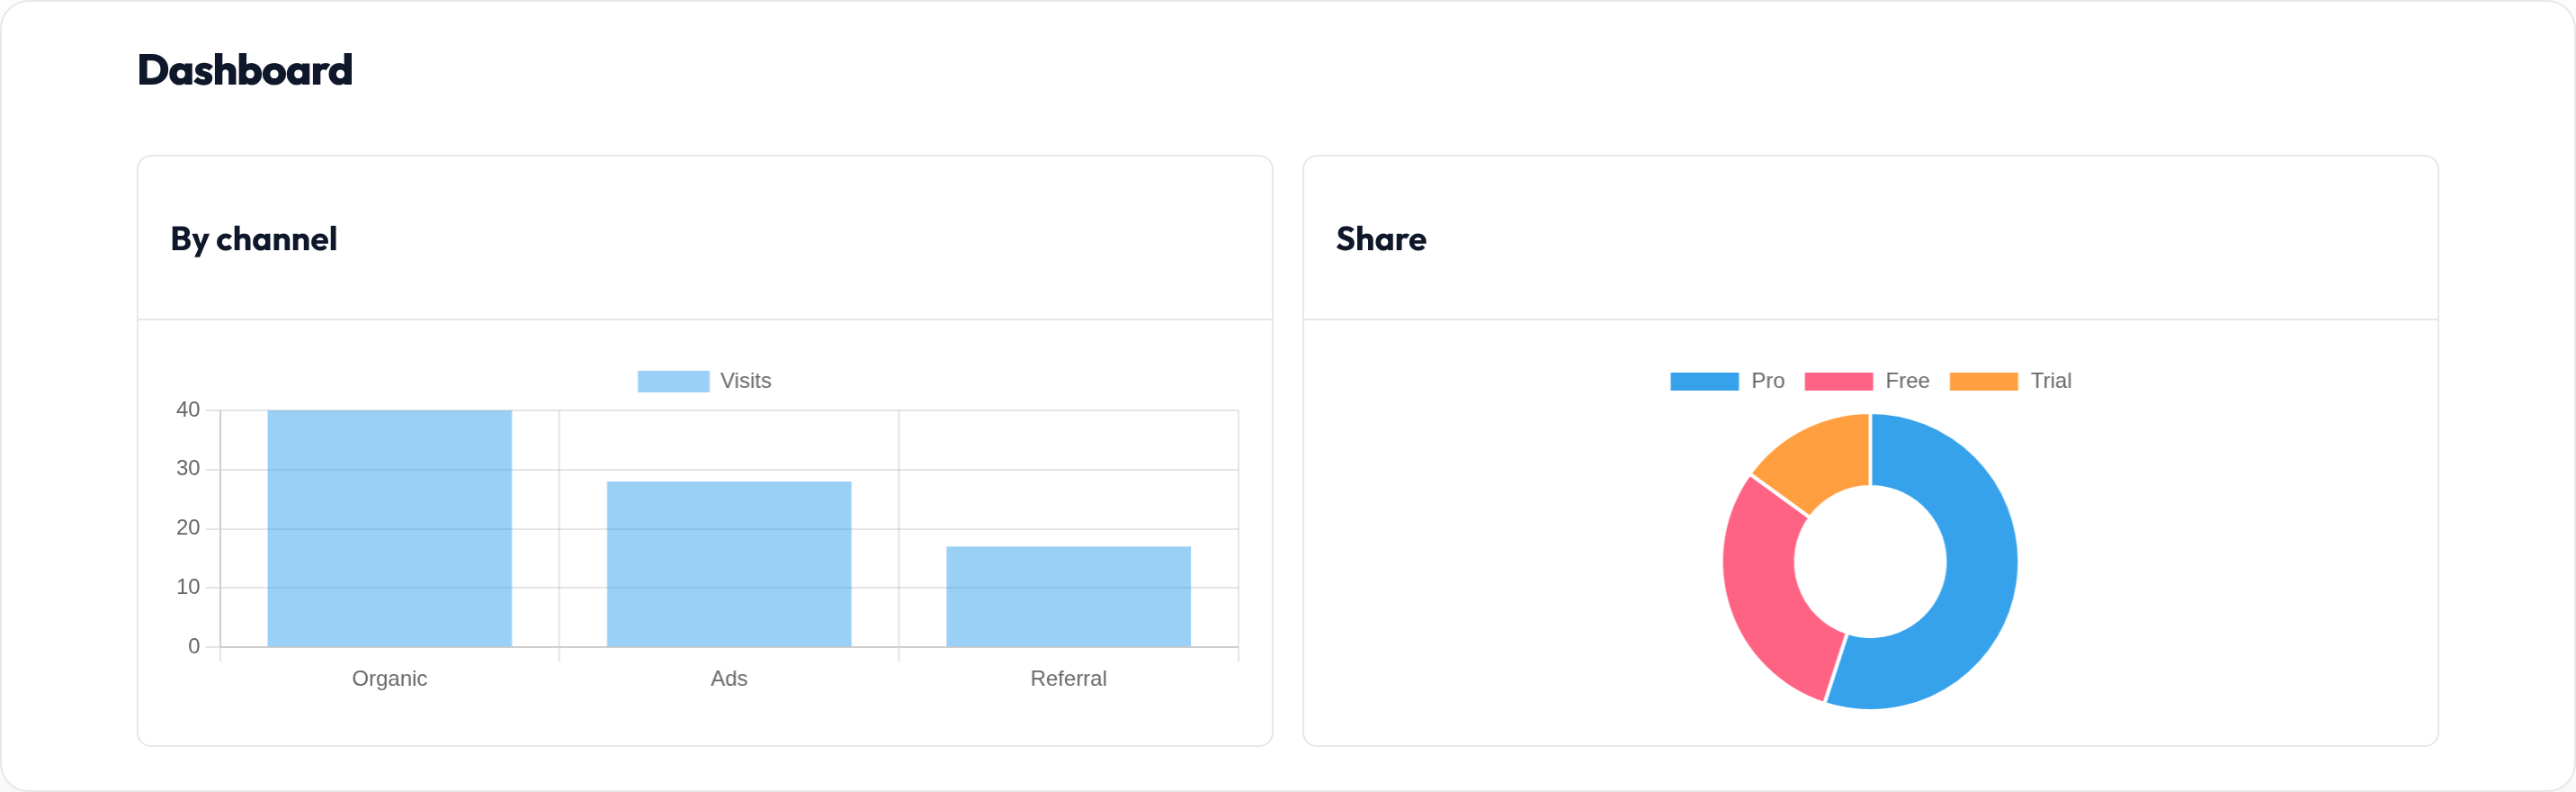
Labels and datasets
Section titled “Labels and datasets”.labels([...]) and .datasets([{...}]) mirror the Chart.js data model. Dataset keys such as label, data, backgroundColor, and borderColor pass through to Chart.js; Apex translation uses label + data.
from almasix.orbit.widgets import ChartWidget
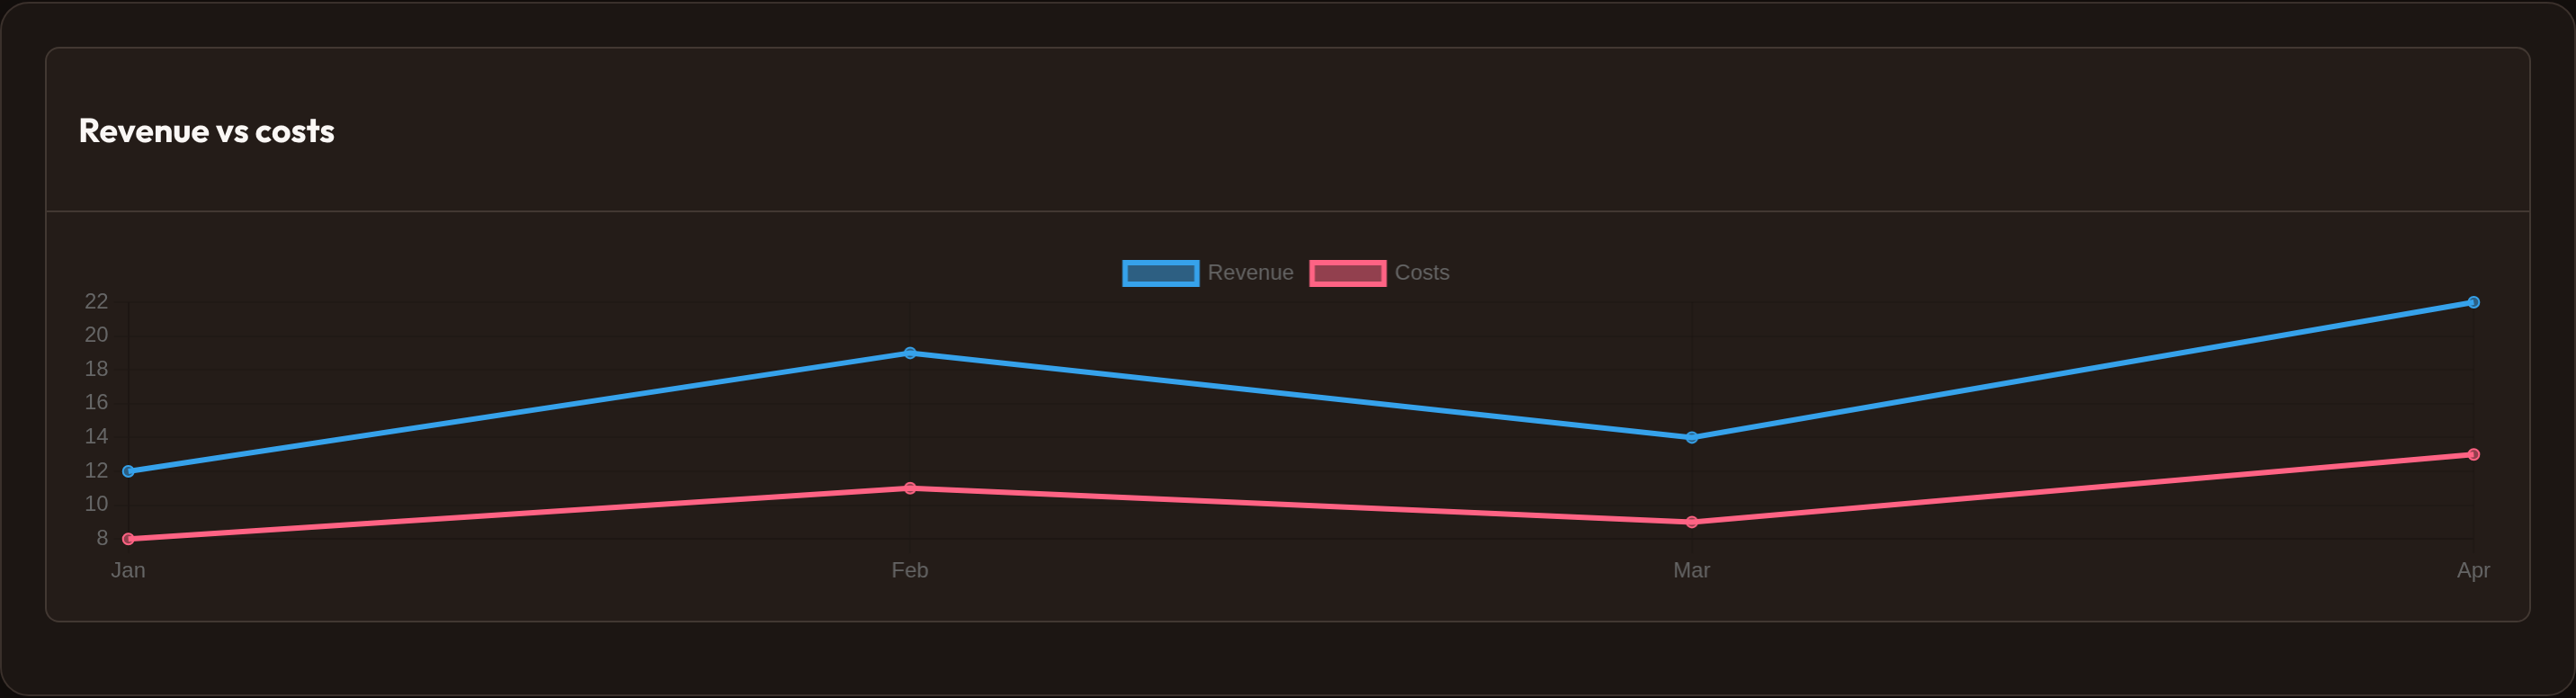
ChartWidget.make("multi")    .heading("Revenue vs costs")    .chart_type("line")    .labels(["Jan", "Feb", "Mar", "Apr"])    .datasets([        {"label": "Revenue", "data": [12, 19, 14, 22]},        {"label": "Costs", "data": [8, 11, 9, 13]},    ])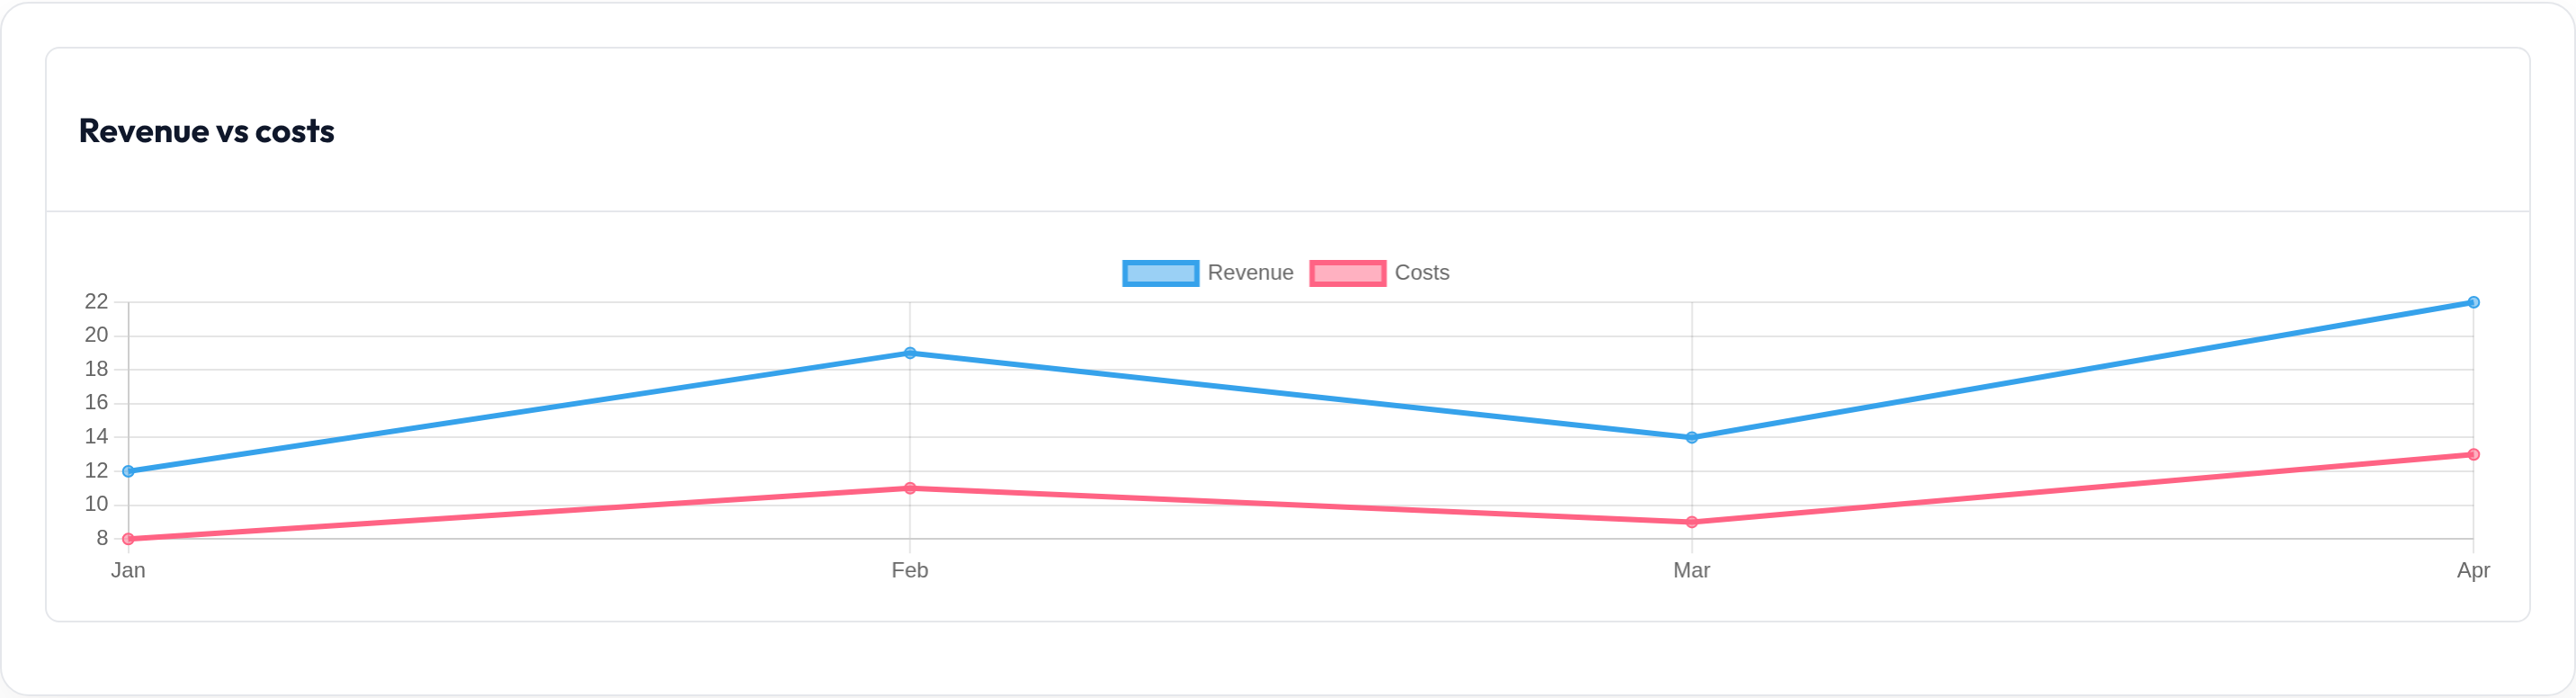
Options
Section titled “Options”.options({...}) merges into Chart.js options. For Apex, either rely on translation + shallow merge, or set a full Apex tree with .apex_options({...}) (wins when present).
from almasix.orbit.widgets import ChartLibrary, ChartWidget
ChartWidget.make("tuned")    .heading("Tuned Chart.js")    .labels(["Q1", "Q2", "Q3"])    .datasets([{"label": "N", "data": [1, 3, 2]}])    .options({"plugins": {"legend": {"display": False}}})
ChartWidget.make("apex_raw")    .heading("Raw Apex")    .chart_library(ChartLibrary.APEX)    .apex_options({        "chart": {"type": "bar", "toolbar": {"show": False}},        "series": [{"name": "N", "data": [1, 3, 2]}],        "xaxis": {"categories": ["Q1", "Q2", "Q3"]},    })
Color and height
Section titled “Color and height”.color("primary") sets or-color-* on the chart host. .max_height("300px") caps the canvas container (default 300px).
from almasix.orbit.widgets import ChartWidget
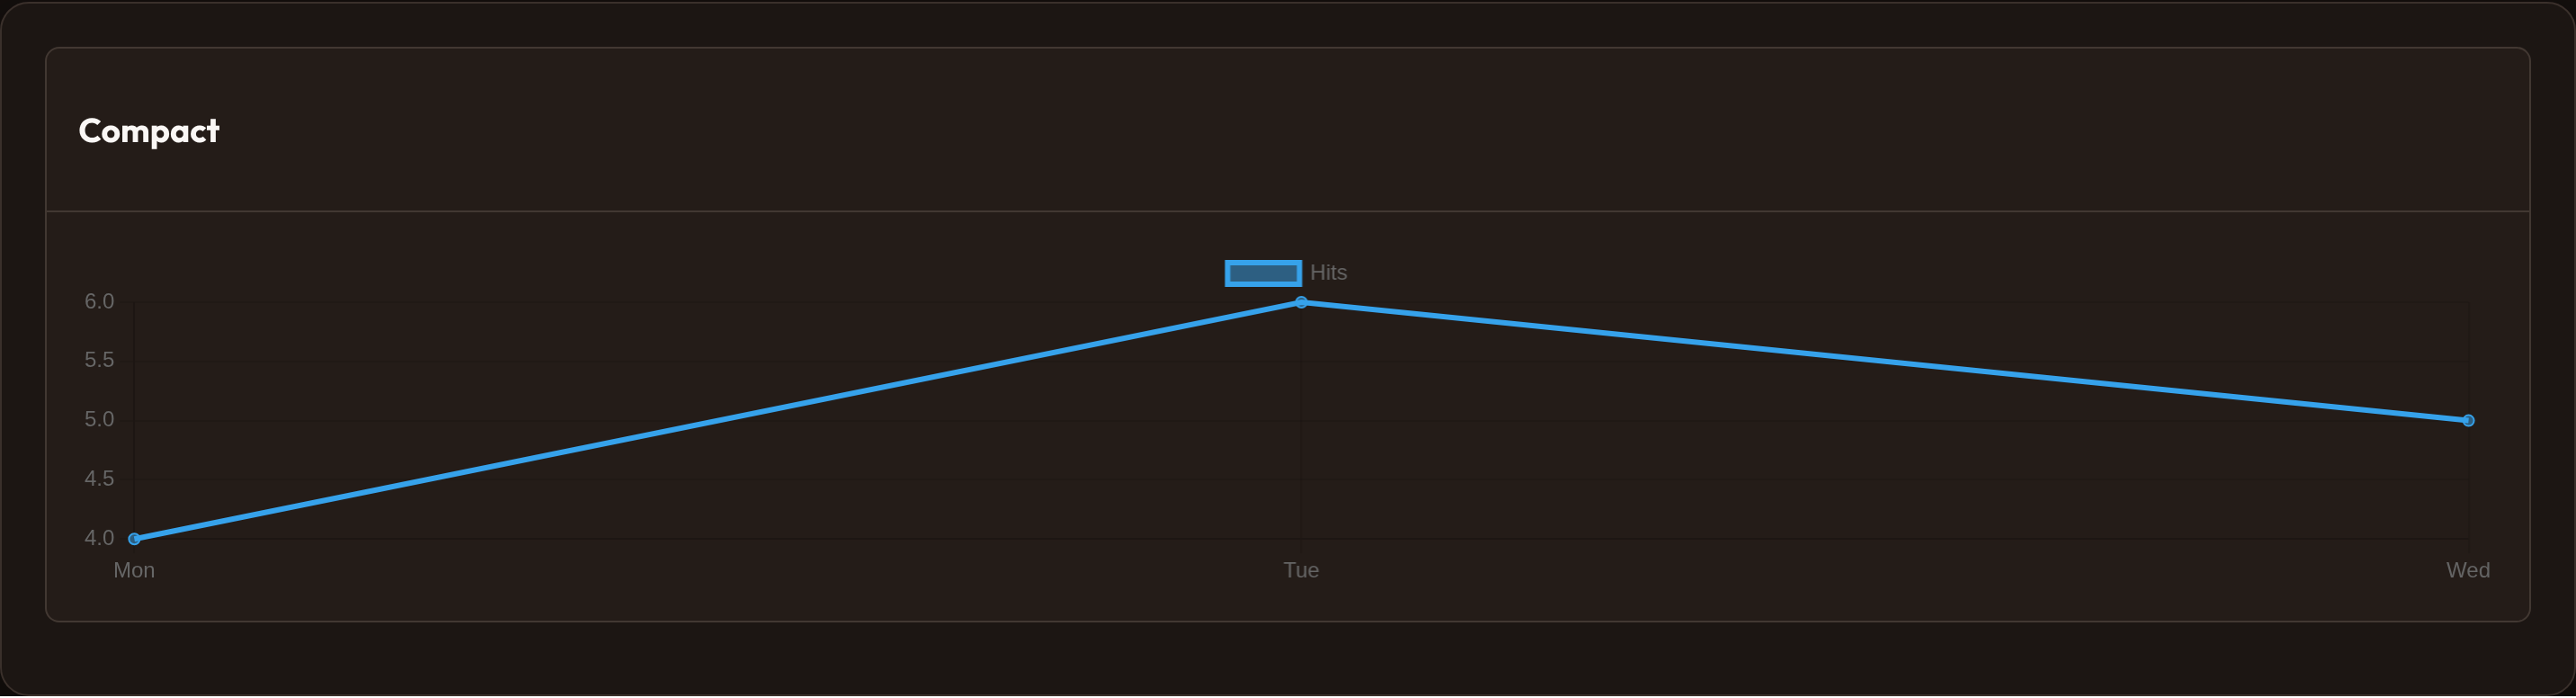
ChartWidget.make("compact")    .heading("Compact")    .color("success")    .max_height("200px")    .labels(["Mon", "Tue", "Wed"])    .datasets([{"label": "Hits", "data": [4, 6, 5]}])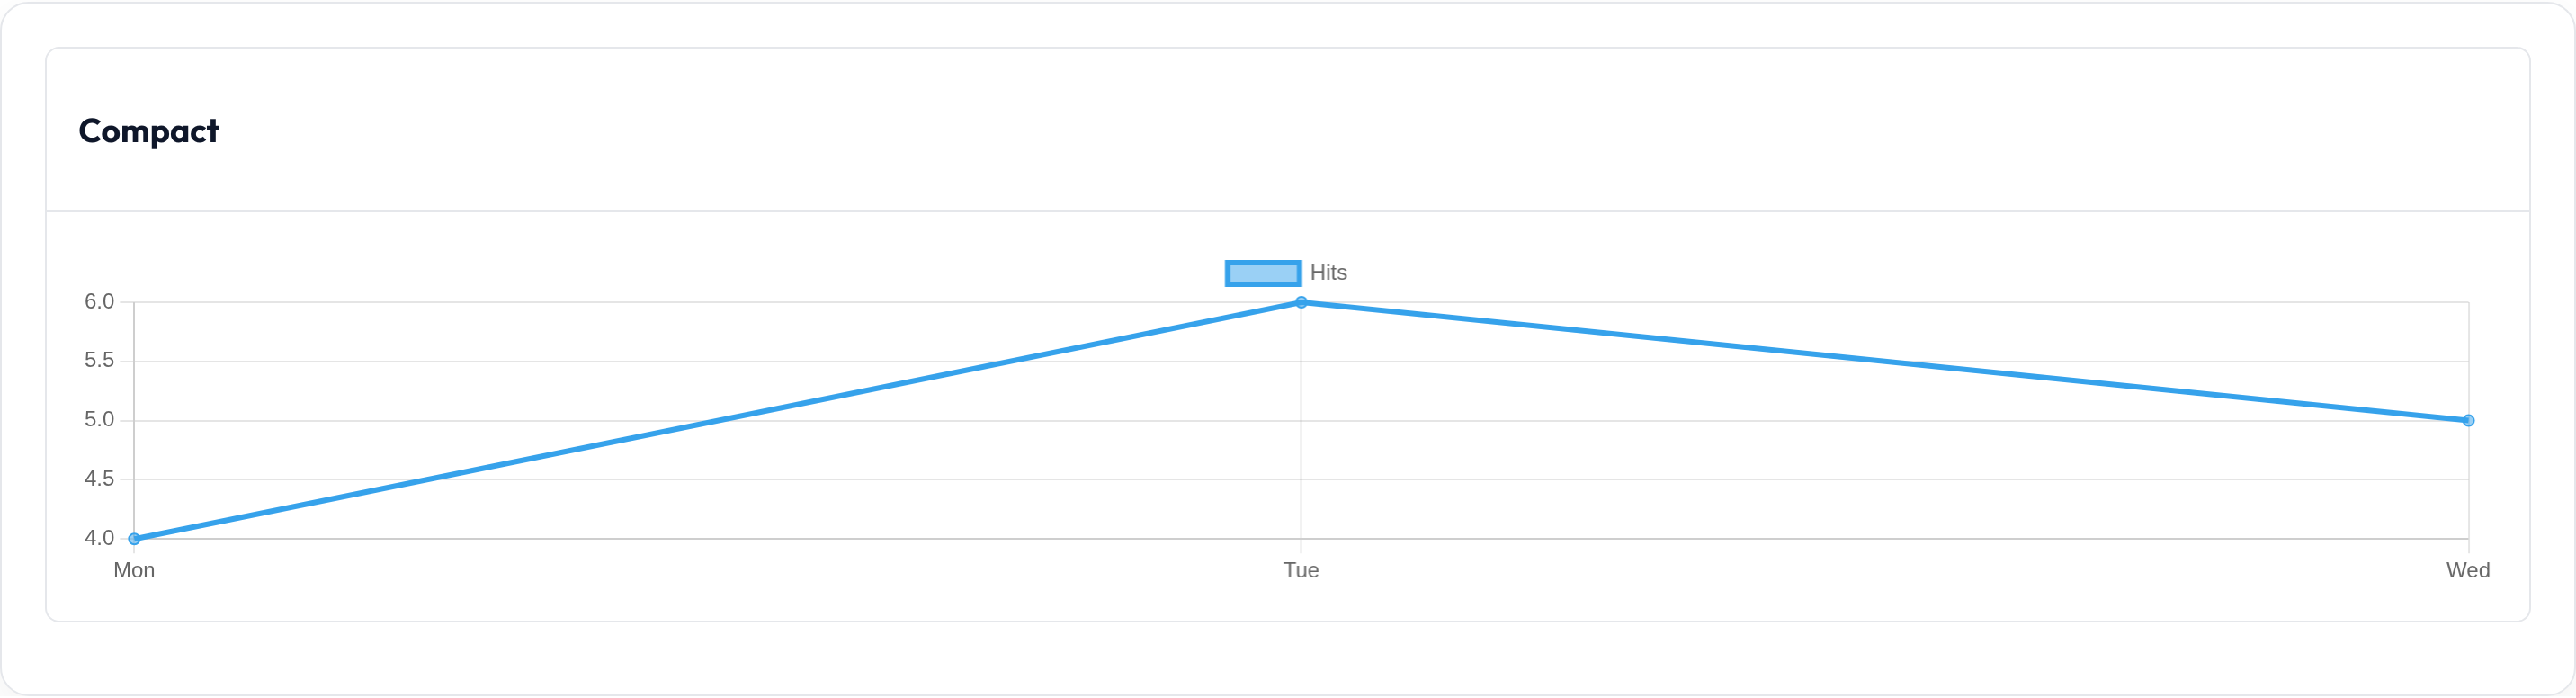
Filters
Section titled “Filters”.filters({"7d": "7 days", "30d": "30 days"}) renders tab buttons above the chart. .filter("7d") marks the active key (decorative in static HTML; wire to your host for live swaps).
from almasix.orbit.widgets import ChartWidget
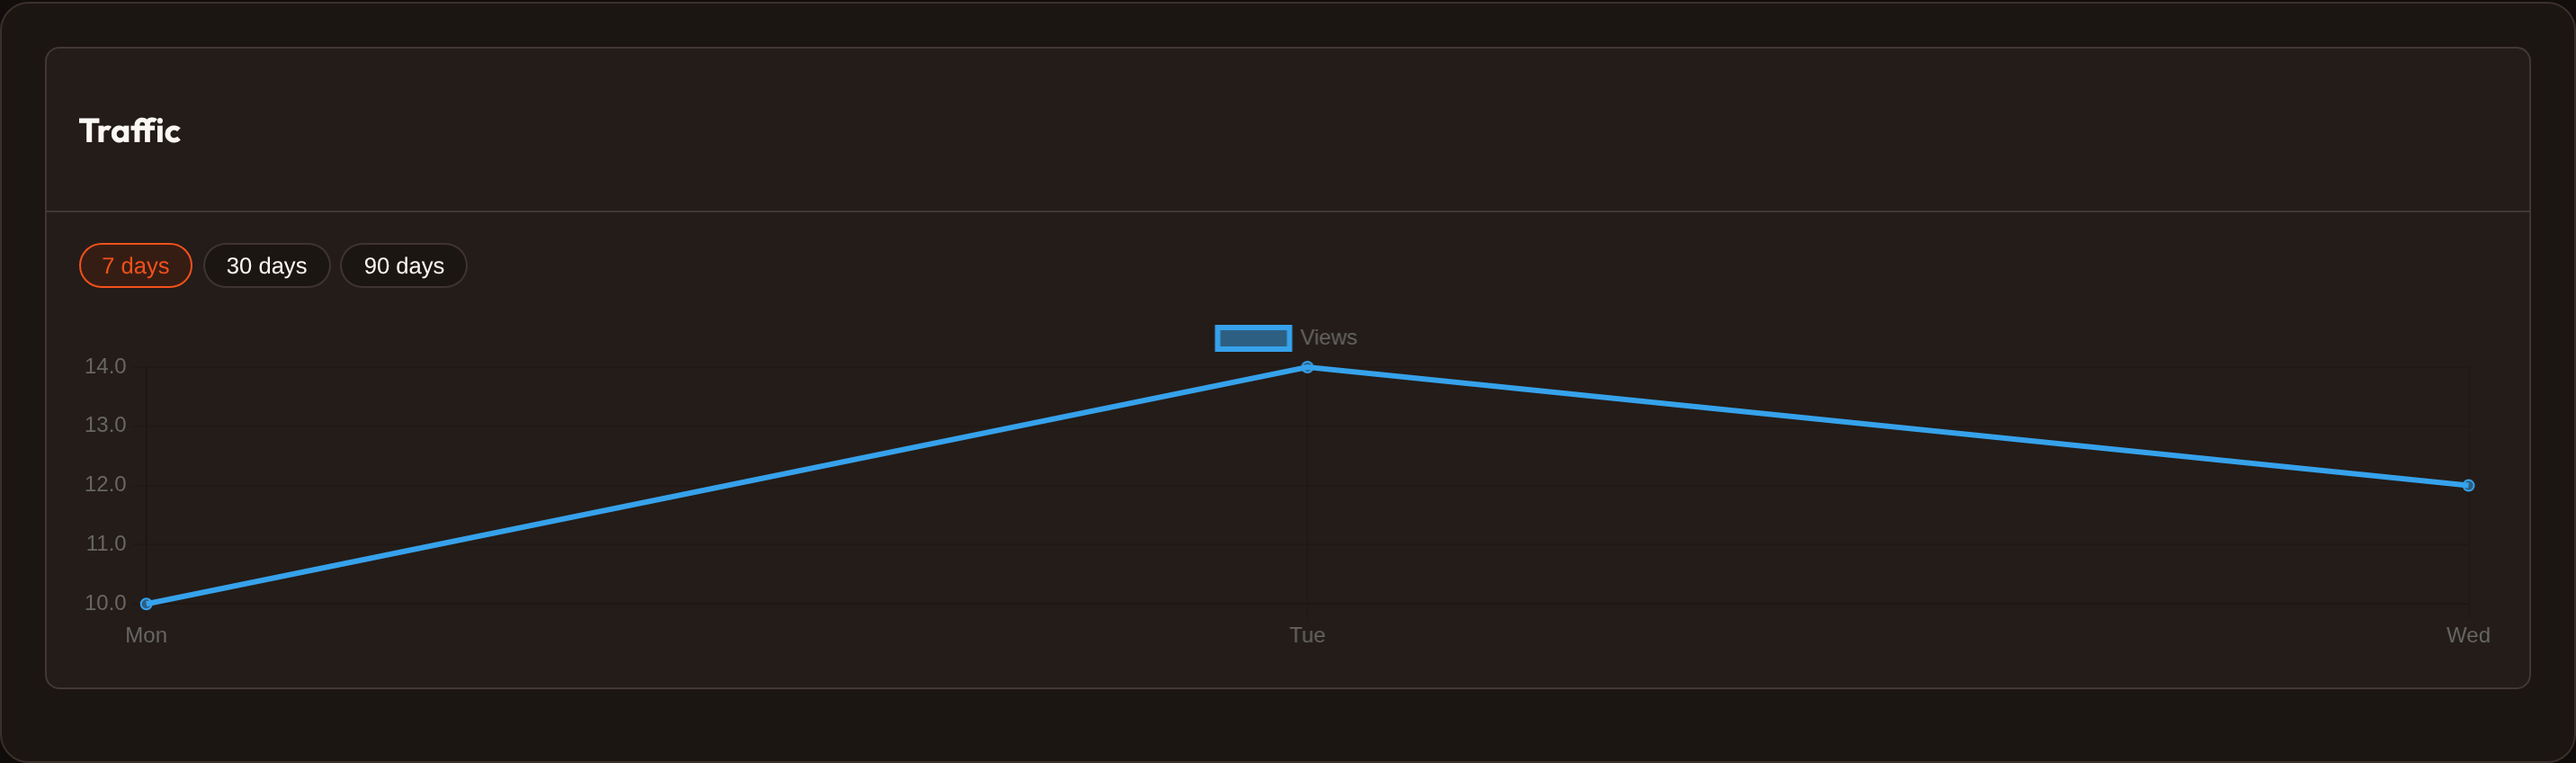
ChartWidget.make("range")    .heading("Traffic")    .filters({"7d": "7 days", "30d": "30 days", "90d": "90 days"})    .filter("7d")    .labels(["Mon", "Tue", "Wed"])    .datasets([{"label": "Views", "data": [10, 14, 12]}])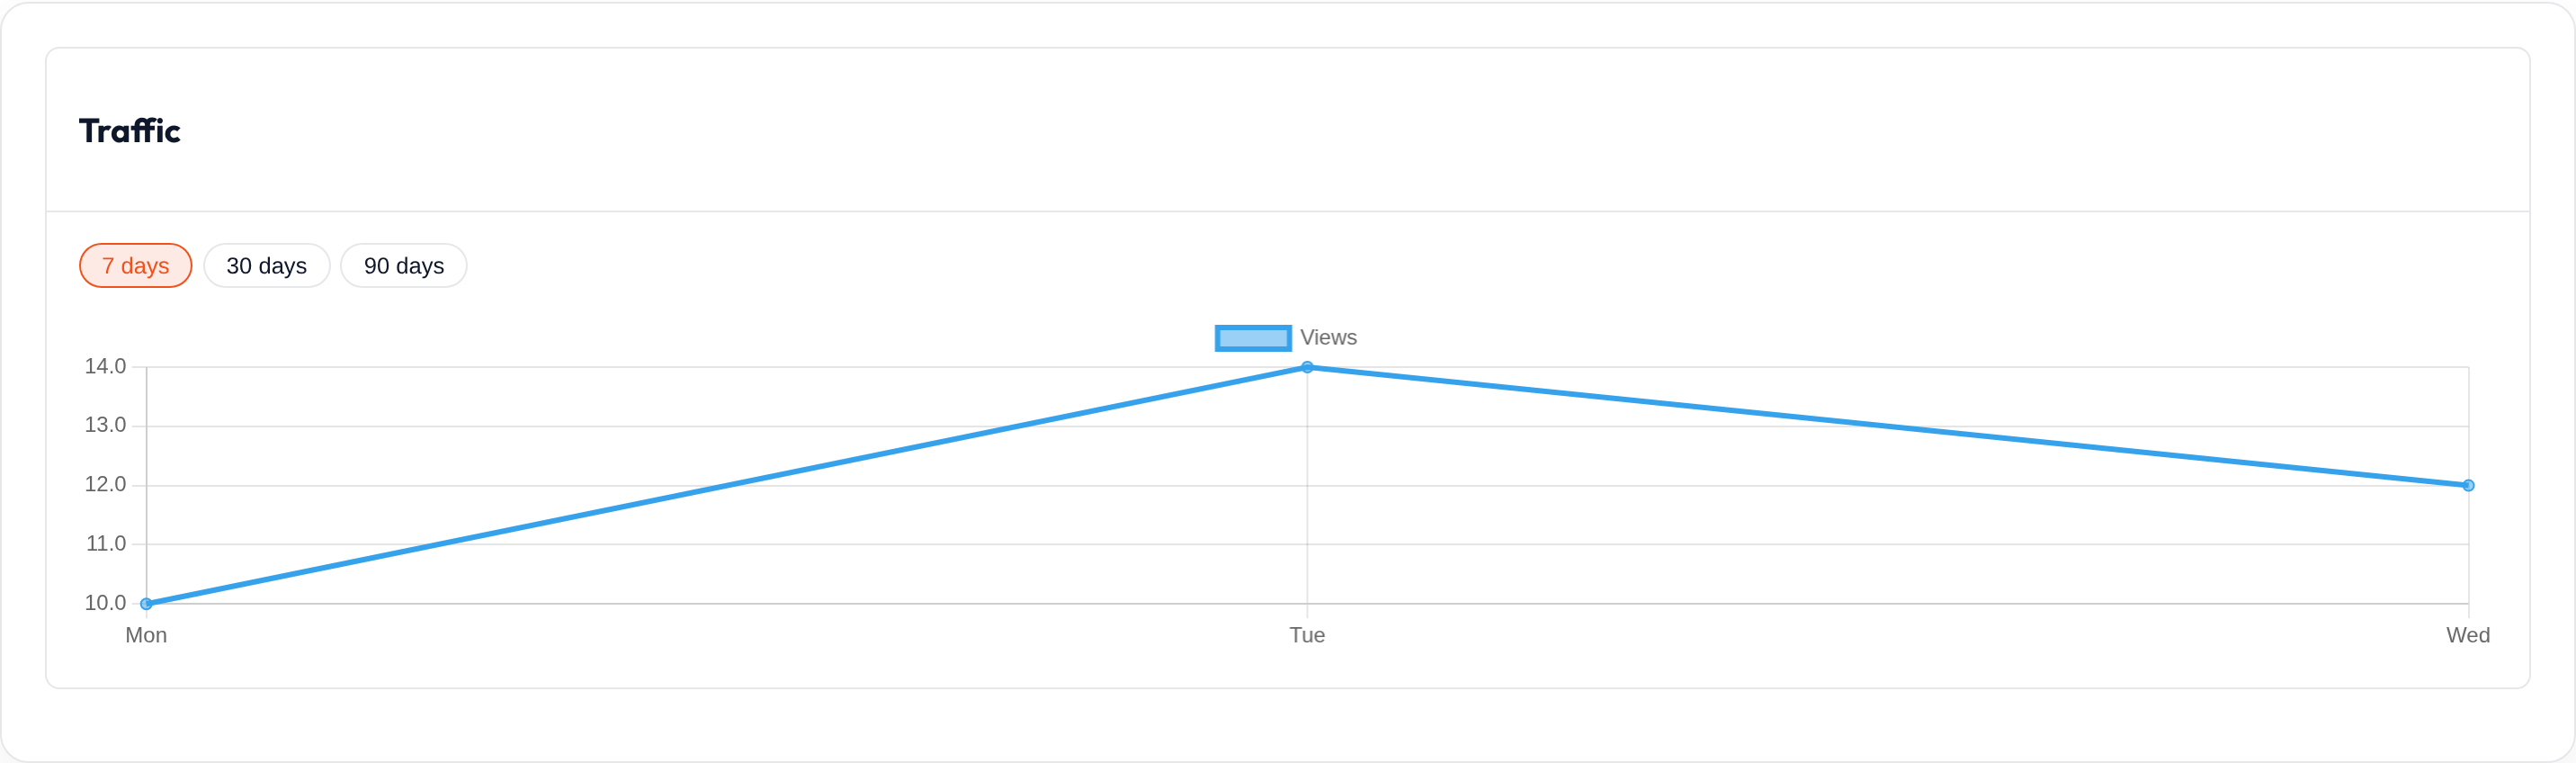
Empty state
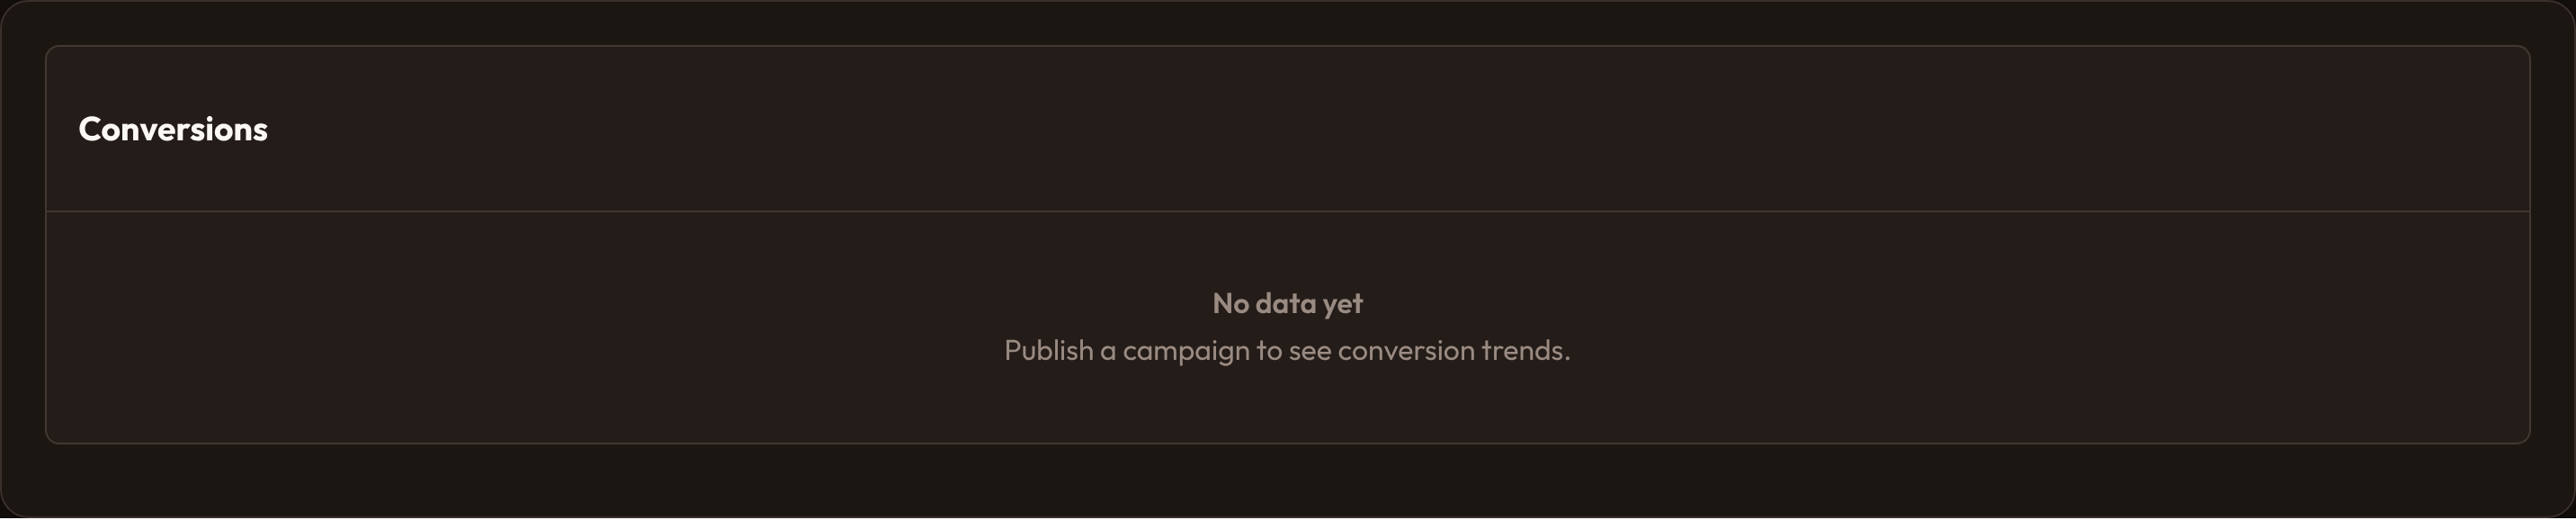
Section titled “Empty state”When labels and datasets are empty (and no Apex options), .empty_state_heading / .empty_state_description render a friendly placeholder instead of a blank canvas.
from almasix.orbit.widgets import ChartWidget
ChartWidget.make("empty")    .heading("Conversions")    .empty_state_heading("No data yet")    .empty_state_description("Publish a campaign to see conversion trends.")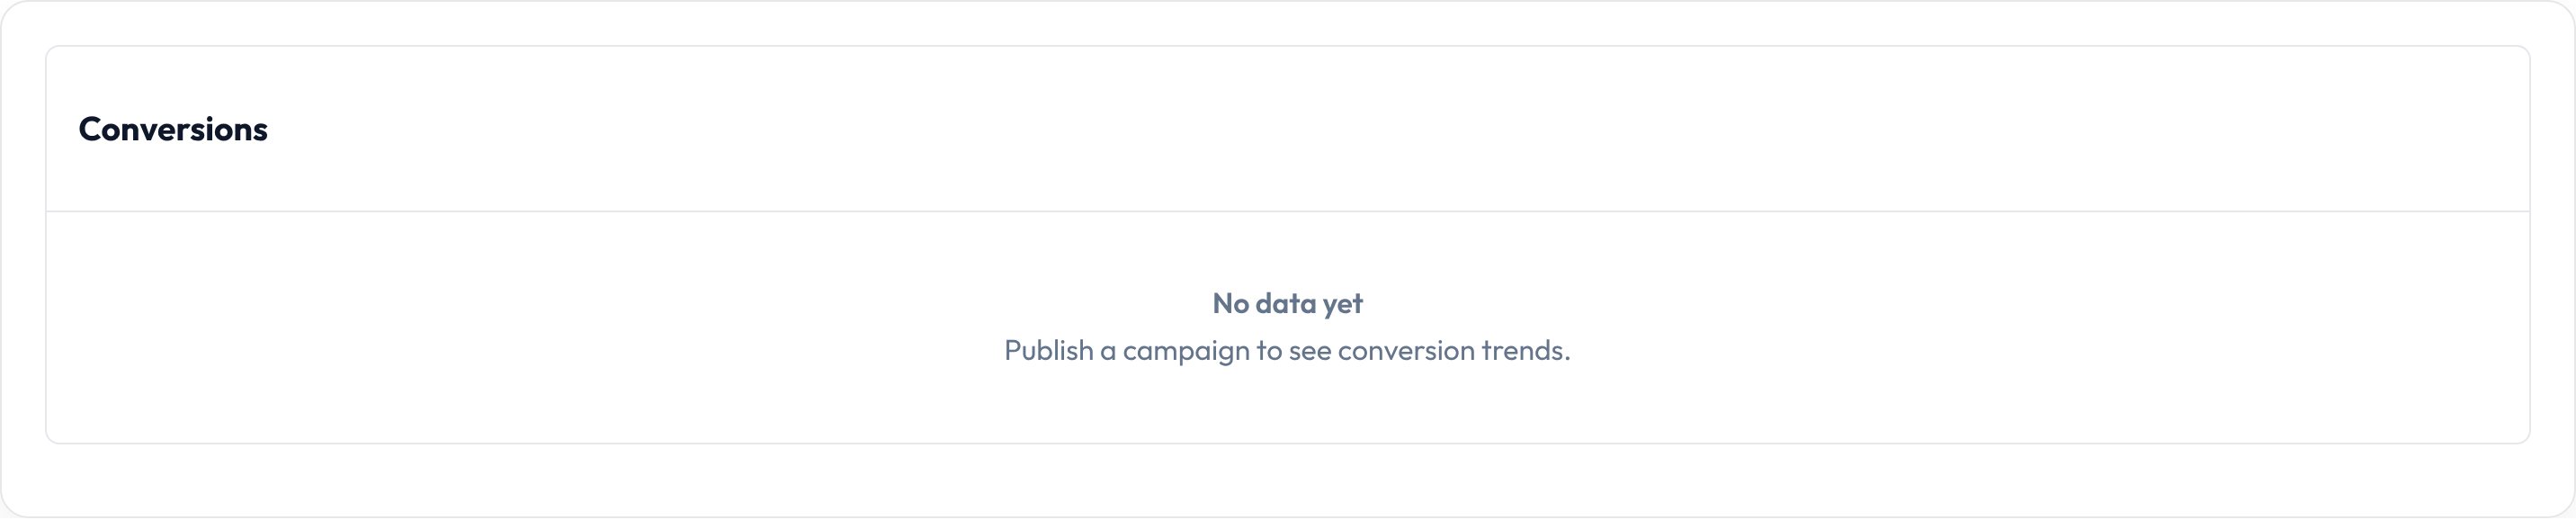
Collapsible
Section titled “Collapsible”.collapsible() sets data-collapsible="true" for hosts that fold chart bodies.
On the dashboard
Section titled “On the dashboard”Subclass ChartWidget, set sort / column_span, configure data in __init__, and register with Panel.widgets([...]). Prefer Chart.js for lightweight sparklines-adjacent dashboards; choose Apex when you need its chart types or option surface.